
Consumption grew at just a 0.1 percent annual rate in the second quarter, while government spending shrank at a 1.1 percent rate, holding GDP growth to 1.3 percent in the quarter. This report also revised down first-quarter GDP growth to just 0.4 percent from a previously reported 1.9 percent. Together, these numbers indicate that the economy is growing far below the 2.5 percent rate needed just to keep the unemployment rate from rising.
A major factor in slowing consumption was a 22.7 percent decline in car purchases, following two quarters of double-digit growth. However, since such a large portion of auto production is now imported, this had relatively little impact on GDP. Excluding motor vehicle output, GDP grew at just a 1.4 percent annual rate. In fact, all components of consumption grew slowly in the quarter. Non-durable consumption grew at just a 0.1 percent rate (down from 1.6 percent in the first quarter) and services grew at a 0.8 percent rate for the second consecutive quarter.
The 1.1 percent decline in government spending shaved 0.23 percentage points off growth. This is considerably less than the 1.23 percentage points in the first quarter that resulted from a 5.9 percent rate of decline. The main difference is that defense spending increased at a 7.3 percent rate in the second quarter after falling 12.3 percent in the first. Quarterly defense spending will always be somewhat erratic, but the general trend at the federal level will almost certainly be negative, amplifying the impact of cutbacks at the state and local levels.
Investment in equipment and software grew at a 5.7 percent rate. This is the third consecutive quarter in which growth has been in the single digits following four quarters in which growth averaged 17.6 percent. Measured as a share of GDP, investment in equipment and software is almost back to its pre-recession level.
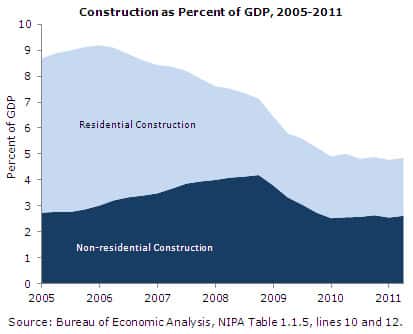
This is not true with investment in non-residential structures. While this increased by 8.1 percent in the quarter, it did not come close to offsetting the 14.3 percent decline in the first quarter. As a result of overbuilding from the bubble, non-residential construction is down by 1.6 percentage points of GDP from its prior peak. Similarly, residential construction is down by almost 4 percentage points from its bubble peak.
Trade was a net positive to growth, adding 0.58 percentage points in the quarter. Most of this was attributable to unusually weak import growth. This was undoubtedly associated with weak auto consumption as well as disruptions created by the disasters in Japan. Net exports will likely be a drag on growth in the second half of the year.
The annual revisions in this report show a somewhat different picture of the recession. Most importantly, the post-Lehman plunge is even sharper than had previously been reported. The economy shrank at a 7.8 percent annual rate in the fourth quarter of 2008 and first quarter of 2009 compared with a previously reported 5.9 percent annual rate. The decline in the second quarter was just 0.7 percent, followed by growth in the third quarter of 1.7 percent, suggesting that the stimulus was effective in turning the quarter around. The downward revision to the first-quarter data coupled with the revision of the fourth-quarter growth to 2.3 percent from 3.1 percent suggests that the winding down of the stimulus has seriously dampened growth.
The revised data also show sharply higher profits for 2008-2010. The profit share of net corporate output rose to 23.8 percent for 2010, more than a full percentage point higher than any level previously recorded. Finance has been the biggest winner, now pulling in 31.7 percent of corporate profits. This compares to less than 10 percent of corporate profits in the 1960s.
The overall picture in this report is of an economy that is stagnating now that the boost from the stimulus is over. This should not be surprising to economists. There is no source of demand to replace the lost construction resulting from the end of the housing boom, coupled with the plunge in consumption due to the loss of more than $6 trillion in housing bubble wealth.
Dean Baker is co-director of the Center for Economic and Policy Research in Washington, D.C. He is the author of several books, including False Profits: Recovering from the Bubble Economy. This article was first published by CEPR on 29 July 2011 under a Creative Commons license.
| Print